In-Depth Analysis
When specific problems come up, the Shepherd performs more in-depth analysis, to understand root causes. This type of analysis is illustrated with a five-part example, broken into the following sections:
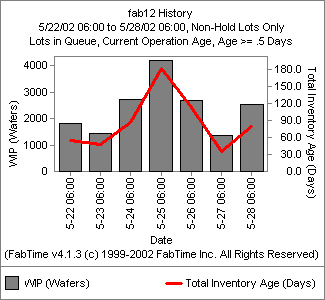
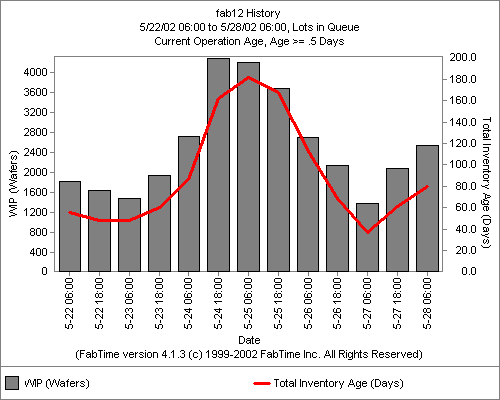
The primary indicator monitored by the Shepherd is the number of inactive lots. The chart below shows the total WIP and inventory age at the start of each 12 hour shift (over a one-week period), filtered to only include lots that have been in queue at their current operation for at least 12 hours (defined as inactives). This chart clearly shows a rise in the number of inactives beginning during the night shift on May 23rd, and continuing for several days.
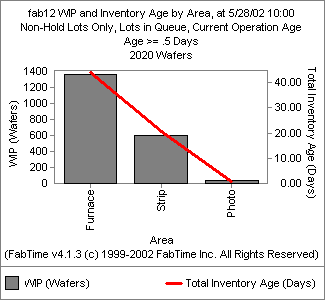
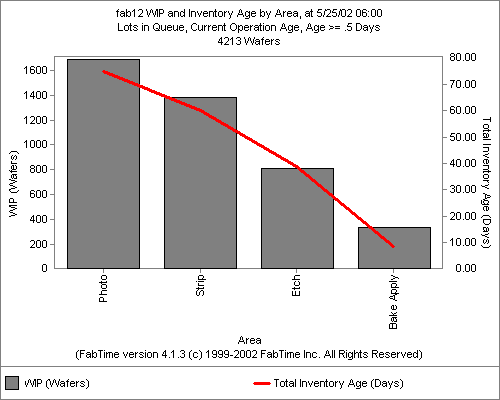
In practice, the Shepherd would be monitoring the number of inactives on an ongoing basis, in addition to looking retrospectively across the current week. For example, the chart below shows the number of inactives and the total inventory age for each area during the peak of the WIP bubble shown above. The high WIP in the Photo area is not unexpected, given known problems at the 5xStep tool group shortly prior to this time (as described in the Traffic Cop example). However, the high number of inactives in the Strip area bears further investigation.
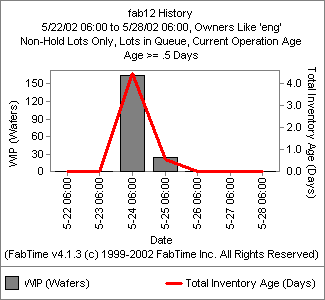
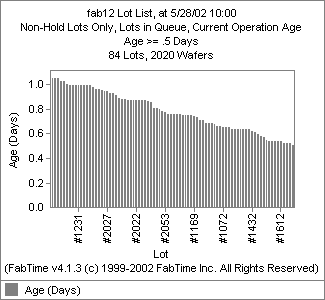
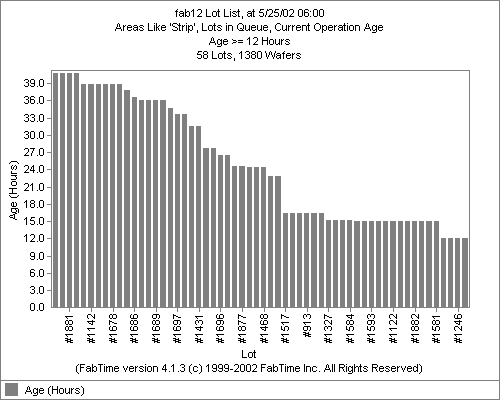
The next chart shows the inactive lots in queue in the Strip area at the peak of the WIP bubble. At 6:00 am on May 25th, there are four lots that have been waiting in queue at their current operation for 39 hours.
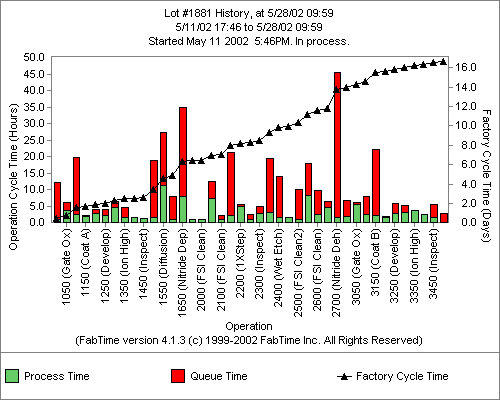
The Shepherd next looks at the detailed operation history of one of the inactive lots, as shown below. The red indicates queue time, while the green indicates process time. This lot spent over 40 hours in queue at operation 2700, a Nitride Dehydrate operation.
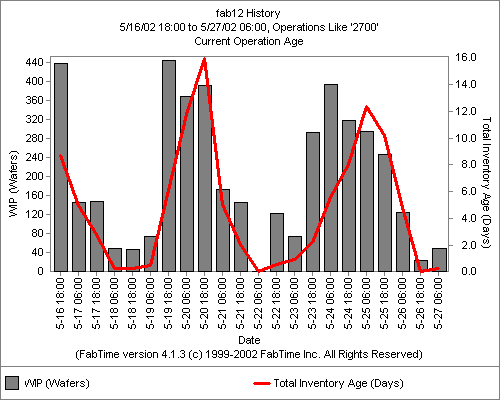
Further analysis of Operation 2700 around the time period of interest shows high, cyclic variability in both WIP and inventory age at Operation 2700.
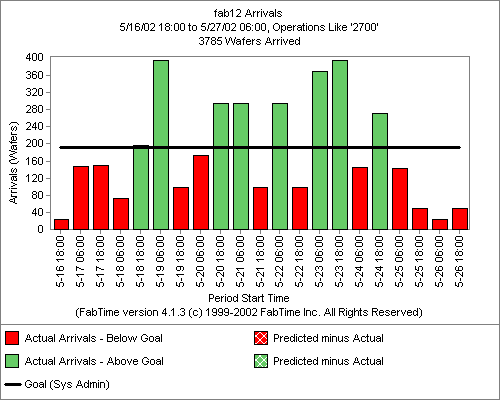
The Shepherd continues by analyzing Operation 2700 in more detail. The chart below shows the number of arrivals to Operation 2700 during each shift. The arrivals are highly variable.
The Shepherd next looks explicitly at the variability in the time between arrivals to Operation 2700, as shown below. Here again, the interarrival times to Operation 2700 are shown to be highly variable. This arrival variability no doubt contributes to the large number of inactive lots sometimes found at Operation 2700.
However, the arrival process variability alone is not sufficient to explain the high variability in the WIP and inventory age at Operation 2700 (the variation in WIP was more cyclic than the arrival variability). The Shepherd investigates further, looking for a root cause.
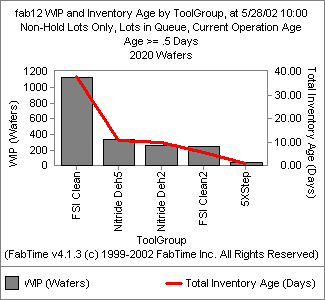
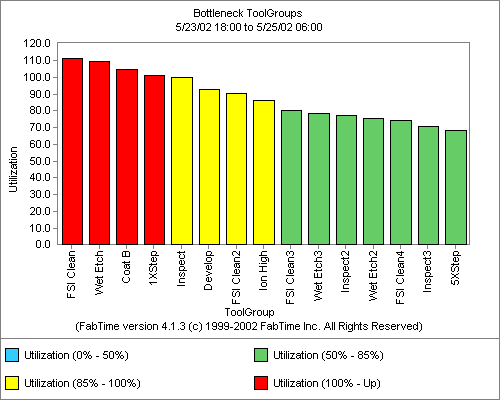
To better understand Operation 2700, the Shepherd looks at the operation-level cycle time by tool group, averaged across the entire time period displayed previously. Operation 2700 was performed on five different tool groups during the period, with approximately the same average process time for each tool group, but a range in the queue times observed.
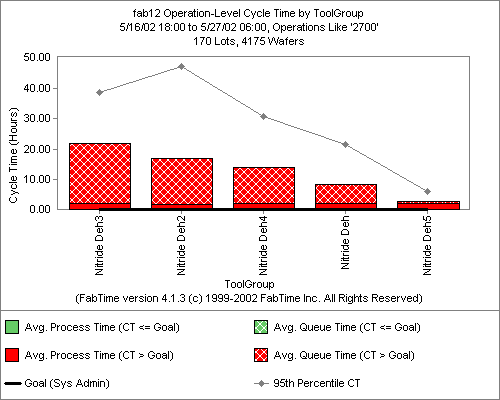
Further investigation reveals that the Nitride Dehydrate tools are dedicated, with two tools in each of the five sub-groups shown above. All five sub-groups can perform Operation 2700, but for different products. So, when a lot of a certain product type arrives, ready to be processed at Operation 2700, that lot must be processed on one of two tools in one of the five sub-groups, rather than on any one of the ten nitride dehydrate tools in the fab. This makes lot queue times highly sensitive to the tool states of the nitride dehydrate tools. As shown below, the nitride dehydrate tools as a whole exhibit considerable variability in availability. The chart below shows the average time in each SEMI E-10 state, across the 10 nitride dehydrate tools, in each shift.
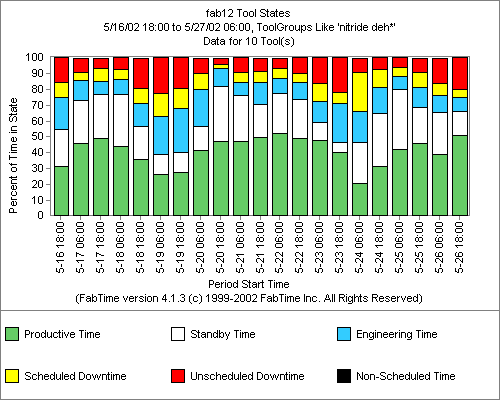
The tool dedication, combined with significant variability in scheduled downtime, unscheduled downtime, and engineering time on the ten tools, leads to variability in moves and operation-level cycle times.
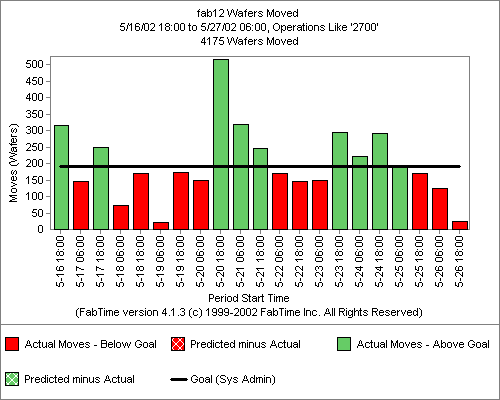
IThe arrival process variability to Operation 2700, combined with the tool dedication and equipment unavailability, results in a high variation in the number of moves per shift at Operation 2700 (as shown below).
Operation 2700 also displays a high variation in operation-level cycle times per visit. The average for each shift ranges from three hours up to 33 hours, across a two week period, as shown below.
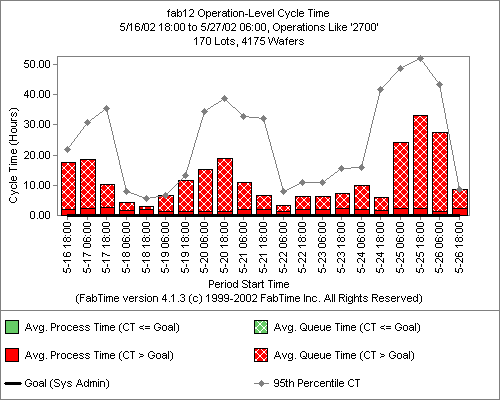
By analyzing inactives retrospectively, as in this example, the Shepherd can identify significant sources of cycle time (like the 33 hours per visit shown above), and suggest corrective measures. In the above example, actions to reduce tool dedication or to smooth the flow of arrivals into nitride dehydrate operations could be useful. More detailed analysis might reveal suggestions for improving the scheduling of preventive maintenance operations, to reduce the chance of lots arriving to find all eligible tools down. On an ongoing basis, managing inactives can also bring problems to light early, before large WIP bubbles have time to occur.
Copyright ©1999-2024 FabTime Inc.