The Traffic Cop’ goal is to monitor and manage starts, to control equipment utilization. What the Traffic Cop does is:
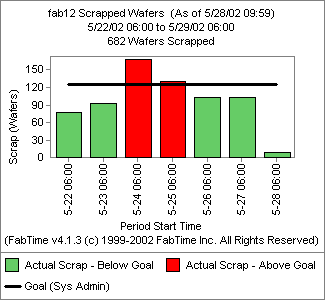
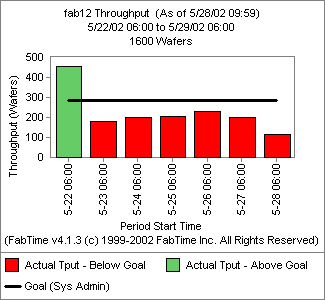
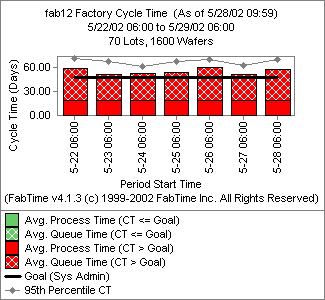
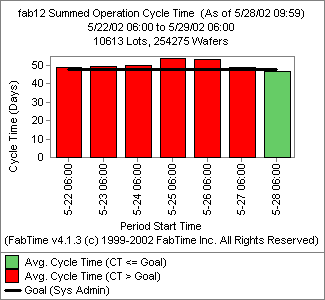
On a daily basis, the Traffic Cop monitors fab performance through a series of summary charts (or dashboard charts). These typically include things like: starts, moves, turns, WIP trend, throughput, cycle time, and scrap charts. We have observed that maintaining a set of dashboard charts such as this one helps people using the Traffic Cop style to be successful. The reason for this is that the Traffic Cop encourages other people in the fab to watch the same dashboard, and thus ensures that problems are noticed immediately, rather than after the fact.
When specific problems come up, the Traffic Cop performs more in-depth analysis, to understand root causes. This type of analysis is illustrated with a five-part example, broken into the following sections:
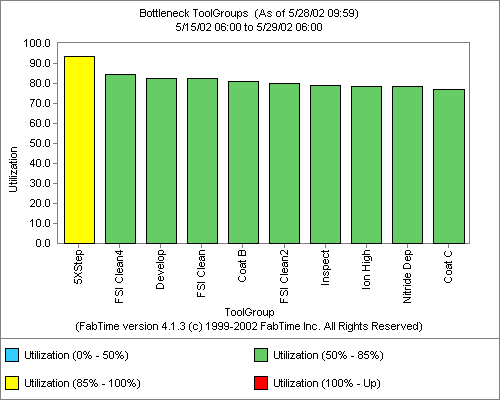
As an example, suppose that the Traffic Cop starts with the following chart, showing the top ten bottleneck tool groups over the past two weeks for a fab. Each column shows actual throughput divided by expected maximum throughput for the two week period. This chart clearly identifies the 5xStep tool group as the bottleneck during the time period of interest - the only tool group with utilization greater than 85%.
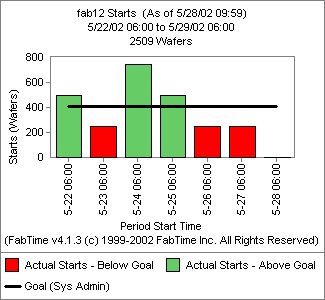
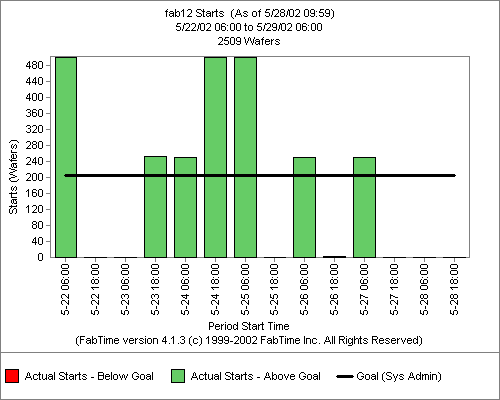
Next, the Traffic Cop looks at fab starts by shift for the current week, to see if the start pattern has been regular or irregular. In this example (shown below), the starts are highly irregular by shift. 500 wafers were started during the day shift on May 22nd, with no wafers at all started during either of the following two shifts.
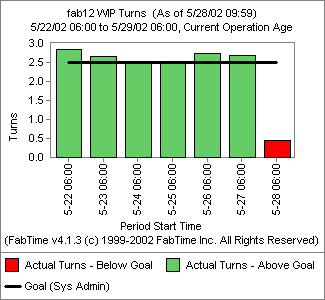
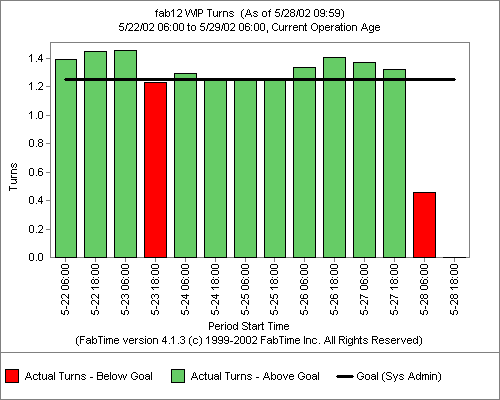
Next, the Traffic Cop checks WIP turns for the same period. WIP turns (operation moves divided by starting WIP) are an excellent early indicator of cycle time problems. Both lower than expected moves and higher than expected WIP will cause turns to be lower than expected. In this example, WIP turns looked great for the first three shifts, but then they decreased by nearly 15% during the next shift, and stayed low for the next several shifts, just barely meeting the goal.
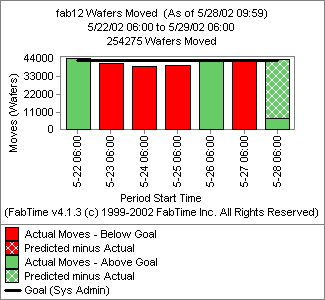
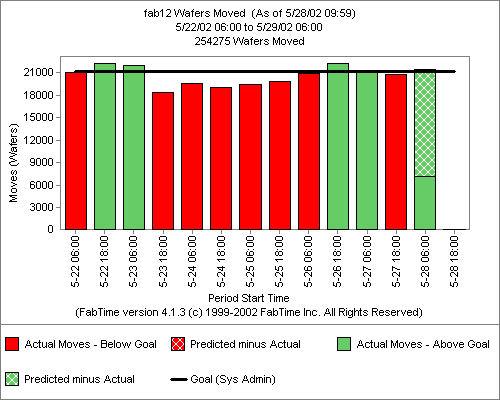
The Traffic Cop begins tracking down the problem that led to decreased WIP turns by looking at factory moves for the same time period. As shown in the figure below, the factory moves also decreased by about 15% between the day shift and the night shift on May 23rd. The moves stayed below goal for several days, before finally recovering on May 26th.
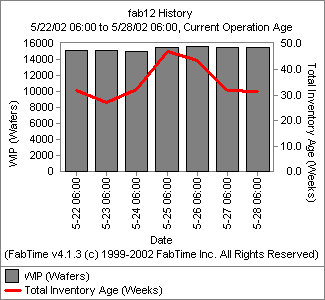
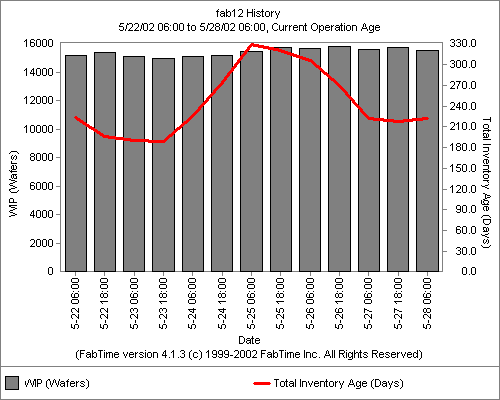
The WIP remained essentially flat during the time period of interest. However, the inventory age began to grow during the night shift on May 23rd, and continued to grow until the 25th. The maximum inventory age reached was nearly double the minimum on May 23rd. Here inventory age is defined as the sum across all lots in the factory of the time that each lot has been at its current operation.
Clearly, then, the problem has to do with lots for some reason not being processed. The next step for the Traffic Cop is to identify which tool groups or areas are causing the problem.
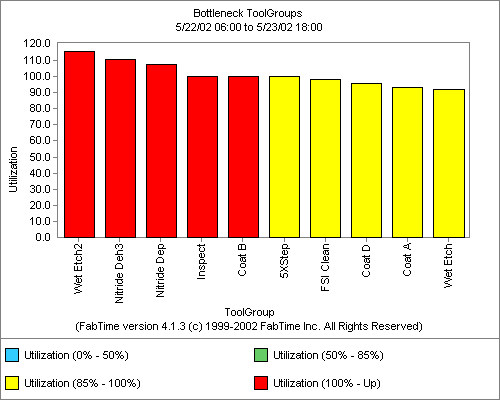
To identify the problem tool group, the traffic cop first looks at the bottleneck tool chart for the three shifts during which turns were high. Note that when looking over a relatively short period (36 hours), the utilization can exceed 100% for some tool groups. This is because utilization is based on maximum expected throughput, which includes assumptions about downtime. The first five tools in the figure below exceeded the expected throughput, at least for a short time. The 5xStep tool group runs at just below 100%.
Next, the Traffic Cop looks at the same chart, for the next three shifts (during the time period when moves and turns were down 15% or so). Here, the utilization of the 5xStep tool group is much lower, only 68%, and the 5xStep tool group appears to be nothing close to a bottleneck, a friendly green color on the chart.
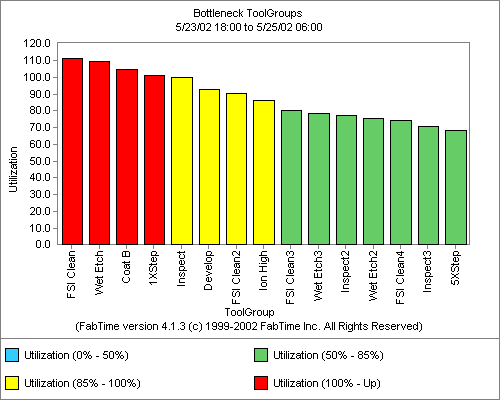
However, the Traffic Cop knows that over the week, the 5xStep tool group is expected to average a 90% loading. Operating at 68% for three shifts will cause a WIP bubble, and the price will be paid in later shifts.
To identify the problem tool group, the traffic cop first looks at the bottleneck tool chart for the three shifts during which turns were high. Note that when looking over a relatively short period (36 hours), the utilization can exceed 100% for some tool groups. This is because utilization is based on maximum expected throughput, which includes assumptions about downtime. The first five tools in the figure below exceeded the expected throughput, at least for a short time. The 5xStep tool group runs at just below 100%.
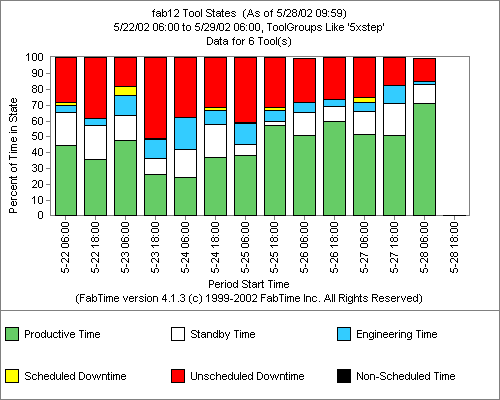
A closer look at the states of each tool during the night shift on May 23rd is shown below. The Traffic Cop observes that three of the six tools in the group had NO productive time at all during the shift. A fourth tool in the group spent more than 15 of its time idle - despite the overall WIP building in the area.
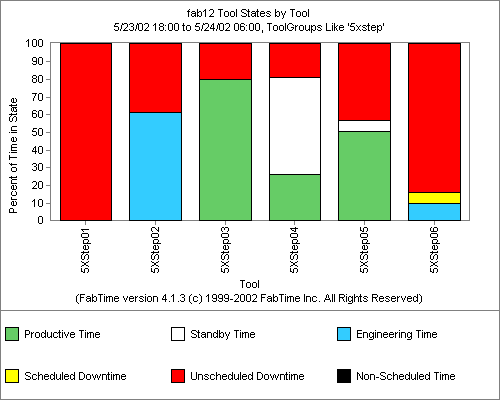
The reduced capacity of the 5xStep tool group clearly contributes to the overall problems with inventory age and WIP turns in the factory. The Traffic Cop takes the analysis one step further, by looking at the impact on cycle time.
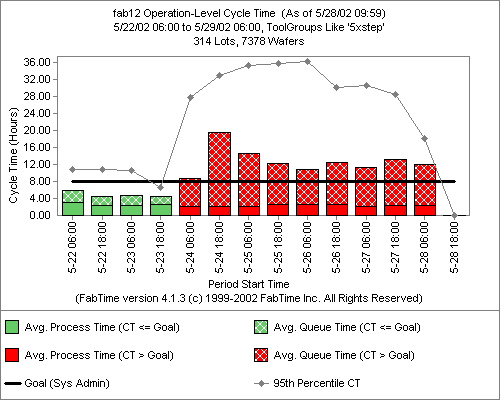
If no corrective action is taken, the extreme downtime in the 5xStep tool group leads to increased operation-level cycle times over the next several shifts. The 95th percentile cycle times are particularly large. Even after four days, the cycle times are still significantly higher than they were before the downtime problem, and exceed the goal for the tool group.
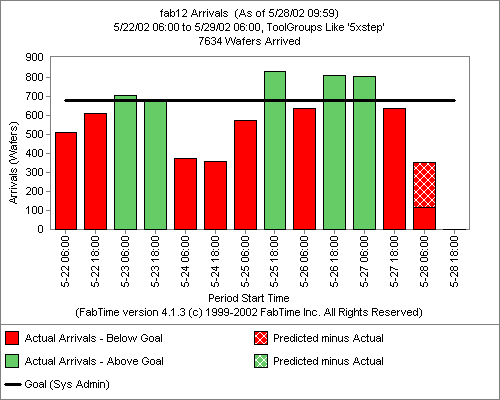
One possible corrective measure which the Traffic Cop can take is to try to slow the rate of arrivals into the 5xStep tool group. As illustrated below, even if no corrective action is taken, the arrival rate into the 5xStep tool group will be less than normal for several days, due to the reentrant nature of the fab (if lots are sitting in queue for the 5xStepper, then they are not able to return for the next layer of processing).
Other potential corrective measures that the Traffic Cop might undertake or recommend, include:
This example illustrated the FabTime cycle time management style known as “The Traffic Cop.” The idea is to monitor bottleneck utilization and factory starts to manage utilization, and thus keep cycle times from becoming a problem. Because a fab is a dynamic environment, sometimes the Traffic Cop can only react (e.g. to downtime problems). WIP turns provide a good early warning system regarding new problems, provided sufficient data is available to track down the problem location (or locations) in the fab.
Copyright ©1999-2024 FabTime Inc.